
Pigs is Pigs
Company culture - namely bureaucracy - has been a known problem since at least 1905.
“Culture eats strategy for breakfast.”
This quote gets thrown around in every offsite and company All Hands like it’s gospel. Most folks credit it to Peter Drucker—the same guy who gave us management-by-objective and once said the most important thing in communication is hearing what isn’t said. It’s unclear whether he actually coined the phrase, but either way, the sentiment is classic Drucker: strategy is what you write down, culture is what actually happens.
And yet, for all the noise about “culture,” it still gets treated like workplace incense. We light it up when things feel off, but nobody really tracks whether it’s helping—or just making the room smell weird.
That’s where this experiment began.
I’ve spent the better part of a decade building B2B SaaS products for enterprise clients, which means I’ve seen the underbelly of how organizations actually run: the slide decks, the pep talks, the onboarding pipelines, the quiet resentment that blooms in year two. One pattern that’s always stuck out to me is how often culture gets referenced but never analyzed.
So, my thesis is simple:
Culture can be measured.
Building the Hypothetical: B2B SaaS & Manufactured Chaos
To stress-test this idea, I created a fictional company. Not just any company, but a proper enterprise B2B SaaS shop—complete with long sales cycles, structured onboarding, and just enough organizational entropy to keep a therapist employed full-time. Think Salesforce meets regional middle management.
Then I asked ChatGPT (calm down) to generate a data set that captured multiple dimensions of this pretend company’s inner life:
CRM and ARR data
Employee engagement scores
Product issue logs
Support and onboarding metrics
But here's the twist: I also asked it to bake in a hidden correlation. Something real and statistically defensible, but undisclosed. My job was to reverse-engineer it like some kind of narrative-driven data spelunking expedition.
Why? Because I wanted this to mimic real life, where the most valuable insights aren’t handed to you—they’re buried inside spreadsheets, conflicting reports, and passive-aggressive Slack threads.
Simple Tech Stack for Poetic Truth
Once I had the data, I rigged up a lightweight but fully operational analysis stack:
PostgreSQL, because querying CSVs in Excel makes my soul itch
Jupyter Notebook, for that cozy blend of code and coffee shop journal
pandas and NumPy, to clean and reshape the data like digital origami
matplotlib and seaborn, to give the data something nice to wear
scikit-learn, to run regressions and pretend I understand linear algebra better than I do
You can see for yourself in the GitHub repo, if you’re curious.
“The truth is like poetry… and most people fucking hate poetry.” - Overheard in a Washington D.C. bar by Michael Lewis
First Contact: CRM Onboarding Time vs ARR
With everything loaded and normalized, I dove into exploratory analysis mode: charting features, running correlations, poking at outliers, and trying to sniff out the invisible string tying culture to outcomes.
The first real signal showed up in the CRM data, like a message scrawled on a whiteboard by someone who really wanted you to connect the dots.
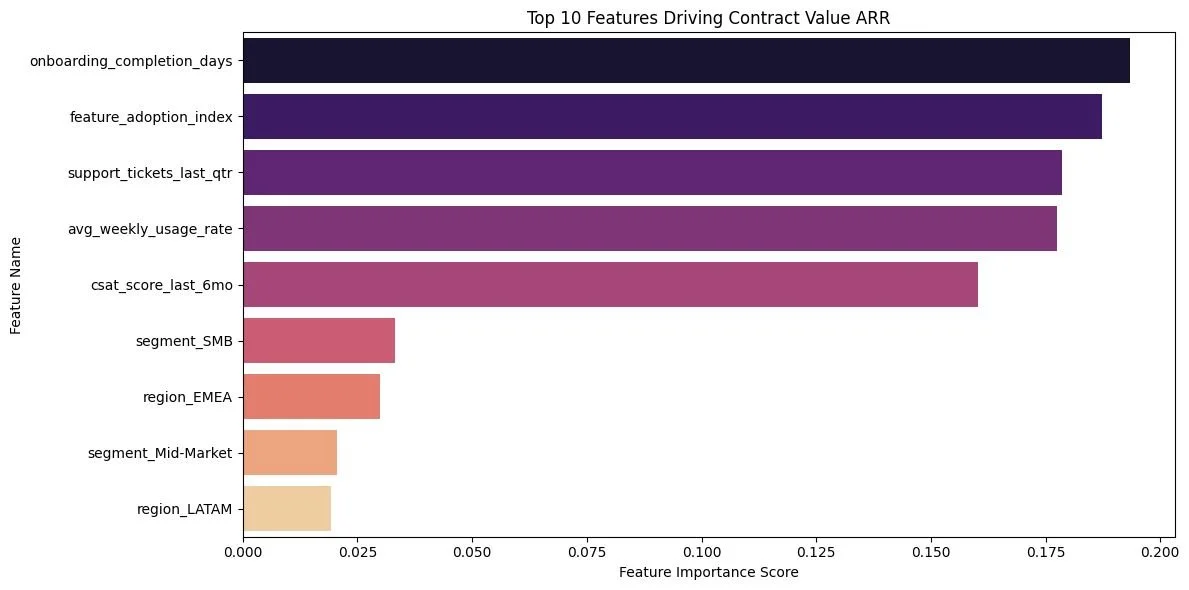
What you’re looking at is a feature importance graph showing the top 10 predictors of contract value (ARR). And the #1 predictor? Not NPS. Not sales rep tenure. Not number of logins.
It was onboarding completion time. While the correlation on its own isn’t especially uh… “strong” (0.2), it’s the strongest in the sample set. So we’ll go with that, for now (this is merely the first set of mock data, after all.)
Turns out, the faster a customer gets through onboarding, the more they spend. Period. And this wasn’t a fluke—it held up across multiple splits of the data.
Which means somewhere inside this company, culture is making itself known: whether it's in documentation quality, team responsiveness, process handoffs, or how quickly someone answers the onboarding email that says “just checking in 😊.” These are not just operational metrics—they're cultural artifacts. And now they have a dollar sign attached.
To confirm the suspicion / correlation, I checked in with ol’ Chatty Cathy about my findings. Here’s what she… it… had to say:

What’s Next?
This blog is going to be my running commentary on this experiment. Less “here’s the answer,” more “here’s the breadcrumb trail I’m following.”
Coming up:
What performance reviews and engagement data have to say when you squint just right
Whether internal product issues can be read as a proxy for psychological safety
How I’m using machine learning to model all of this without accidentally building a startup pitch deck
And somewhere down the line, maybe we’ll figure out if culture eats anything for lunch. Or if lunch, too, is just a meeting that could’ve been a Slack message.
That’s all for today.
Now go have some lunch.
In loving memory of Regan Davis.